Sourced From Lex Pelger’s newsletter
Also read
On identifying cannabis in fingerprints with ToF-SIMS imaging
Application of ToF-SIMS to detection and imaging of cannabis-contaminated fingerprints – A preliminary study
https://pubmed.ncbi.nlm.nih.gov/41176961/
,
,
,
and
DNA Profiling Laboratory, Biology Division, Health Sciences Authority, 11 Outram Road, Singapore 169078, Singapore
This article belongs to the Special Issue Advances in Forensic Genetics and DNA
Abstract
Background/Objectives: According to the World Drug Report 2025, cannabis is the most abused drug in the world, being sold in illicit markets in various physical forms ranging from herbal cannabis to cannabis resin and liquid cannabis.
Currently, the methods used for cannabis identification are largely based on the morphological features and chemical content of the product. In this respect, identification could be severely impacted if the product is highly fragmented or pulverised. As such, DNA-based molecular techniques offer a viable alternative detection approach. In this study, we have developed a robust DNA testing method for cannabis identification, with high sensitivity and specificity.
Methods/Results: Two plant DNA barcode regions, rbcL and matK, were successfully amplified in a cohort of 54 cannabis plant samples. DNA sequences obtained from these samples were blast-searched against GenBank and resulted in returned matched identity of at least 99% compared to their corresponding Cannabis sativa reference sequences. In addition, the amplification of two cannabis-unique markers, the tetrahydrocannabinolic acid synthase (THCAS) and cannabidiolic acid synthase (CBDAS) genes, produced amplicons with expected sizes only in cannabis samples; these amplicons were not detected in those plants closely related to cannabis. Sequence comparison of the majority of samples yielded at least 97% matched identity against C. sativa reference sequences in GenBank. The THCAS and CBDAS markers detected only the cannabis DNA in varying levels of cannabis–hops and cannabis–tobacco DNA mixtures. Lastly, the use of the four markers could effectively differentiate between cannabis and non-cannabis in 27 blinded samples, including 18 actual casework samples. Conclusions: In conclusion, these four genetic markers can be used to discriminate cannabis from other plant species at the genus level, especially in challenging forensic samples lacking morphological features which therefore cannot be determined by traditional detection methods. As such, this method can complement existing techniques to identify a myriad of cannabis samples.
Keywords:
1. Introduction
Cannabis is the most widely abused drug globally, with approximately 244 million users according to the World Drug Report released in 2025 [1]. In forensic casework, cannabis identification typically relies on physical characteristics and chemical detection of major cannabinoids (tetrahydrocannabinol [THC], cannabidiol [CBD], and cannabinol [CBN]). As recommended by the United Nations Office on Drugs and Crime (UNODC), the analysis of cannabis materials (loose leaves or compressed blocks) includes a macroscopic examination of plant morphology, microscopic identification of distinct cystolithic hairs unique to cannabis leaves, and chemical analysis to confirm the presence of major cannabinoids [2].
A variety of DNA techniques have been evaluated for identifying cannabis samples since 1990s, including random amplified polymorphic DNA (RAPD) [3], amplified fragment length polymorphism (AFLPs) [4], inter-simple sequence repeats (ISSRs) [5], chloroplast and nuclear DNA barcoding [6,7,8,9], and short tandem repeats (STRs) [10,11]. Among these, the DNA barcoding system is widely used in plant taxonomy, with commonly targeted regions including nuclear DNA (e.g., ITS1 and ITS2) and chloroplast DNA (e.g., trnL-trnF, trnH, psbA, psbK, rbcL, and matK). Because a single locus often lacks sufficient discriminatory power and can be difficult to amplify in some plant species, a multi-locus DNA barcoding method was recommended for plant species identification. In 2009, the Plant Working Group of the Consortium for the Barcode of Life (CBOL) proposed a two-locus combination of plastid coding genes matK and rbcL as the standard plant DNA barcodes [12]. rbcL is well-conserved and easy to amplify, but it sometimes has low discriminatory power [13,14]. In contrast, matK offers higher discriminatory power; however, it is harder to amplify due to its rapid evolving nature [12,13,14,15]. Therefore, the combined utilisation of these two DNA barcodes was proposed in plant identification and used in this study.
Beyond plant DNA barcodes, the most direct approach to identify cannabis samples is to examine for cannabis-specific DNA markers: tetrahydrocannabinolic acid synthase (THCAS) and cannabidolic acid synthase (CBDAS) genes [16,17]. THCAS and CBDAS encode for enzymes that catalyse cannabigerolic acid (CBGA) to tetrahydrocannabinolic acid (THCA) and cannabidiolic acid (CBDA), respectively [18,19]. Despite having ~84% DNA sequence identity, THCAS and CBDAS differ in function and are associated with different chemotypes [19,20]. Recent genomic studies on various cannabis cultivars have revealed that THCAS and CBDAS genes, including their multiple copies of non-functional pseudogenes, are situated in a complex locus interspersed with retrotransposon-rich repeats [21,22,23,24,25]. Furthermore, the CBDAS pseudogene tends to share high sequence similarity (91–95%) with the CBDAS functional gene [23,24]. As such, designing primers to specifically target the functional CBDAS gene may prove to be challenging.
According to Singapore legislation, it is currently illegal to consume, possess, traffic, import, or export any cannabis material regardless of the variety of cannabis (e.g., drug-type or fibre-type). Conventional methods for cannabis identification are deemed inadequate in cases where the material has been processed till the sample lacks the morphologically distinct traits of cannabis plant material and/or contains a low THC level; for example, in a highly fragmented form or as young seedlings, seeds, roots, or bare branches. In such stances, DNA-based molecular techniques offer a promising alternative for detection to supplement existing detection methods. To address this gap, the present study evaluated the performance of four genetic markers comprising two universal plant DNA barcodes (rbcL and matK) and two cannabis-unique genes (THCAS and CBDAS) by using PCR-based methods and comparing DNA sequences obtained by Sanger sequencing to all DNA sequences in GenBank to detect cannabis plant material. We anticipate that this method will only be deployed on a subset of cases to supplement and not replace the mainstream methods of cannabis identification due to it cost ineffectiveness.
2. Materials and Methods
2.1. Plant Materials
The use of all cannabis samples in this study was approved by the relevant law enforcement agency in Singapore. These seized samples (n = 54) had previously been verified by the Illicit Drugs Laboratory (IDL), Health Sciences Authority, to be cannabis through a combination of physical examination (macroscopic and/or microscopic) and chemical analyses (thin-layer chromatography and gas chromatography–mass spectrometry), as recommended by UNODC [2]. A variety of cannabis samples (e.g., fresh plant material, dried plant material, petroleum ether-extracted plant material, petroleum ether-extracted indistinguishable plant material and hemp seeds) were obtained from IDL to evaluate the robustness of this current testing method across different sample types.
Other plant samples used for evaluation of method specificity included Humulus lupulus (Homebrew Co-Op, Singapore); Celtis sinensis and Pteroceltis tatarinowii (Jiangxi Academy of Sciences Biology Resource Institute, China); Trema tomentosa, Chaetachme aristata, Gironniera parvifolia, and Gironniera subaequalis in the Cannabaceae family; Ficus pumila and Morus alba in the Moraceae family; Boehmeria nivea and Cercropia peltata in the Urticaceae family; Nicotiana tabacum (National Parks Board, Singapore); and Camellia sinensis (Fairprice, Singapore).
A further 27 blinded samples containing 18 actual casework samples were obtained from IDL and the relevant law enforcement agency to challenge the specificity and robustness of the method developed. All plant materials used in this study were stored at room temperature.
2.2. DNA Extraction
Some cannabis samples used for the present study had been previously processed by IDL with petroleum ether for extraction of cannabinoids such as THC and CBD [2], then air-dried as per IDL’s standard analysis procedures.
Plant materials were pulverised using a freezer mill (Cole-Parmer sampleprep, Metuchen, NJ, USA). Pulverised plant samples were stored at −20 °C. DNA extraction was performed on 50 mg aliquots using the Maxwell® RSC PureFood GMO and Authentication Kit (Promega, Madison, WI, USA). Briefly, the pulverised plant material was pre-processed with 700 µL of CTAB buffer supplemented with 14 µL of RNase A solution (4 mg/mL) and 28 µL of proteinase K solution (20 mg/mL) and incubated in a thermomixer at 65 °C for 1 h, with shaking at 750 rpm. After incubation, sample tubes were centrifuged at room temperature for 10 min at 20,000× g.
Three hundred microlitres of supernatant was carefully collected (avoiding oils and solids) into a new 1.5 mL tube. An equal volume of lysis buffer was added, and the resulting lysate was then pipetted into well #1 of a Maxwell RSC reagent cartridge that had been prepared as per manufacturer’s instructions. The cartridge was placed into the Maxwell® FSC instrument (Promega, Madison, WI, USA) for automated purification. Purified DNA was eluted in a total volume of 50 µL elution buffer (10 mM Tris, 0.1 mM EDTA, pH 8.0) and stored at −20 °C.
2.3. DNA Quantification
DNA recovery was determined using the QuantiFluor® ONE dsDNA System with a Quantus™ Fluorometer (Promega, Madison, WI, USA), according to the manufacturer’s protocol. The purity of DNA samples (A260/280 ratio) was not evaluated.
2.4. PCR Amplification of DNA Markers
Two regions of the chloroplast DNA, i.e., rbcL and matK, and two cannabis-unique protein-coding genes, i.e., THCAS and CBDAS, were targeted for PCR amplification using the primers listed in Table 1. The rbcL and matK primers were adapted from Maloukh et al. [26], while THCAS primers were adapted from Stiasna et al. [27]. CBDAS primers were designed using Geneious Prime 2021.2 (Dotmatics, Boston, MA, USA). The CBDAS primers used for the detection of the CBDAS gene were also capable of amplifying the CBDAS-like genes and CBDAS pseudogenes due to their high sequence similarities and this will be discussed in the later section. Thirty nanograms of template DNA was used in a 50 µL PCR reaction consisting of 0.2 µM of each forward and reverse primer, and 25 µL of 2x NEBNext® Ultra II Q5® Master Mix (New England Biolabs, Ipswich, MA, USA). DNA was amplified using the ProflexTM PCR system (Thermo Fisher Scientific, Waltham, MA, USA) with the following protocol: initial denaturation at 95 °C for 15 min; 35 cycles of denaturation at 94 °C for 30 s; annealing at either 55 °C (rbcL and matK), 58 °C (CBDAS), or 65 °C (THCAS) for 45 s; extension at 72 °C for 1 min; and a final extension at 72 °C for 10 min.

Table 1. Primers used for amplification of THCAS, CBDAS, rbcL, and matK and Sanger sequencing.
Successful PCR amplification was visually confirmed through gel electrophoresis on a 1.2% (w/v) agarose gel containing FloroSafe DNA stain (1st Base, Singapore). PCR products were purified with ExoSAP-ITTM Express PCR Product Clean-up Kit (Thermo Fisher Scientific, Waltham, MA, USA) for Sanger sequencing according to the manufacturer’s protocol.
2.5. Sanger Sequencing
The purified PCR product amplified with CBDAS primers was sequenced using its respective forward or reverse sequencing primer while PCR products of the other three markers were sequenced with either M13 forward or M13 reverse sequencing primer with the BigDyeTM Terminator v3.1 Cycle Sequencing Kit (Thermo Fisher Scientific, Waltham, MA, USA). Sequencing reactions were purified with the BigDye XTerminatorTM Purification Kit according to the manufacturer’s protocol (Thermo Fisher Scientific, Waltham, MA, USA). DNA sequencing was performed using the 3500xL Genetic Analyser (Applied Biosystems, Foster City, CA, USA)
2.6. Data Analysis
Sanger sequencing results were analysed using the software Geneious Prime 2021.2 (Dotmatics, Boston, MA, USA). Briefly, raw DNA sequences sequenced with either M13 forward or reverse primer were trimmed approximately 30 to 50 base pairs from the initial start and end of the sequence depending on the sequence quality. Occasionally, DNA sequences sequenced with either CBDAS-5F1 or CBDAS-5R primer would require trimming of approximately 50 to 200 base pairs from the initial start and end of the sequence due to the presence of a CBDAS mixture sequence or poor sequence quality. The consensus sequence of each sample was then generated and searched against all DNA sequences in GenBank using the NCBI nucleotide BLAST tool (https://blast.ncbi.nlm.nih.gov/Blast.cgi?PROGRAM=blastn&PAGE_TYPE=BlastSearch&LINK_LOC=blasthome, accessed on 13 October 2025). Subsequently, the matched identity (% Identity) of queried sequences that match to known reference sequences deposited in GenBank for each sample was obtained.
3. Results
3.1. Proof of Concept: Demonstrating Feasibility of Using THCAS, CBDAS, rbcL, and matK to Identify C. sativa
A literature search was performed to identify suitable markers that could be used to identify C. sativa. As a proof of concept, four selected markers, i.e., two pairs of cannabis-specific primers, THCAS and CBDAS, and two pairs of primers targeting plant DNA barcodes, rbcL, and matK, were amplified with the genomic DNA extracted from a cannabis plant material. As shown in Figure 1, the four DNA markers, THCAS, CBDAS, rbcL, and matK, generated specific PCR products of expected sizes 825 bp, 981 bp, 635 bp, and 928 bp, respectively. The DNA sequences obtained from these four amplicons were compared with the reference sequences deposited in GenBank and the BLAST results showed that sequences generated from THCAS, CBDAS, rbcL, and matK all matched to C. sativa references with more than 99% of matched identity, indicating successful identification.
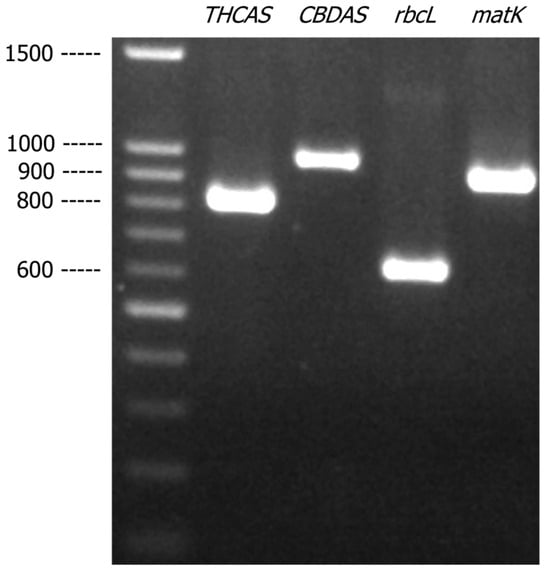
Figure 1. Agarose gel (1.2% w/v) showing the PCR-amplified products of THCAS, CBDAS, rbcL, and matK from cannabis genomic DNA.
3.2. THCAS and CBDAS Are Unique to C. sativa
Tetrahydrocannabinol (THC) and cannabidiol (CBD) are naturally occurring substances reported to be unique to C. sativa. To demonstrate the species specificity of THCAS and CBDAS which encode enzymes involved in the biosynthesis of THC and CBD, respectively, various plants from cannabis closely related families were tested: H. lupulus (hops), C. sinensis, P. tatarinowii, T. tomentosa, C. aristata, G. parvifolia, and G. subaequalis from the Cannabaceae family; F. pumila and M. alba from the Moraceae family; and B. nivea and C. peltata from the Urticaceae family. Two other plants whose leaves have been found laced with THC in drug crime seizures—N. tabacum (tobacco) and C. sinensis (green tea)—were also tested for the presence of the THCAS and CBDAS.
As shown in Figure 2A,B, primers designed for THCAS were specific to cannabis. A band of the expected size (825 bp) was detected in all cannabis samples (Lane 1–5, Figure 2A), but not in the other samples (Lane 6–10, Figure 2A and lane 11–19, Figure 2B). Similarly, the CBDAS primers produced a 981 bp amplicon only in the cannabis samples (Lane 1–5, Figure 2C). The absence of THCAS and CBDAS amplicons in these other related plant species supported the Cannabis-specificity of THCAS and CBDAS; these two markers were therefore incorporated into the development of this DNA-based assay for the forensic identification of cannabis plant material.
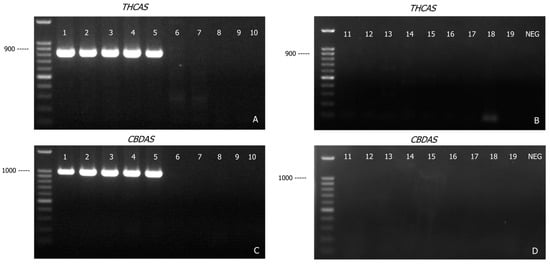
Figure 2. Agarose gel (1.2% w/v) detection of PCR-amplified products of THCAS (A,B) and CBDAS (C,D) genes from various plant materials. Lane 1, Cannabis sativa; Lane 2, hemp seed I; Lane 3, hemp seed II; Lane 4, hemp seed III; Lane 5, hemp seed IV; Lane 6, hops-inflorescence; Lane 7, hops-pellet; Lane 8, Celtis sinensis; Lane 9, Pteroceltis tatarinowii; Lane 10, Trema tomentosa; Lane 11, Chaetachme aristata; Lane 12, Gironniera parvifolia; Lane 13, Gironniera subaequalis; Lane 14, Ficus pumila (Moraceae family); Lane 15, Morus alba (Moraceae family); Lane 16, Boehmeria nivea (Urticaceae family); Lane 17, Cercropia peltata (Urticaceae family); Lane 18, Camellia sinensis (green tea); Lane 19, Nicotiana tabacum (tobacco); NEG: PCR negative control.
3.3. Generation of THCAS, CBDAS, rbcL, and matK Amplicons with as Little as 0.5 ng Genomic DNA
THCAS (Figure 3A) and CBDAS (Figure 3B) amplicons could be generated from as little as 0.1 ng and 0.5 ng of cannabis genomic DNA, respectively, whereas rbcL (Figure 3C) and matK (Figure 3D) amplicons could be generated from as little as 0.05 ng of cannabis genomic DNA. This was not unexpected given the higher copy number of the chloroplast genome compared to the nuclear genome. Using the least sensitive marker (CBDAS) as the baseline, the approach developed in this study has a detection sensitivity of 0.5 ng genomic DNA.
Read more at. https://www.mdpi.com/2073-4425/16/11/1320/